Given that this invoice ninja is a time tracking software (this is entirely how I use it, to track hourly work and send invoices), I am surprised I am not able to see any metrics regarding hours worked on the dashboard for given time periods. Using the invoice rollup and dividing by my hourly rate doesn’t work very well because for one I may use different rates for different clients, and two if a task is invoiced in that date range, the entire value of that task is included in the rollup, even if much of that task was completed outside that date range, as far as when the hours were logged.
What I would really like to see, is the number of hours logged to all tasks over the selected date range, on the dashboard. Is there a way to do this that I don’t know of? From there, I can use an average hourly rate to get an idea of my performance for a certain window of time, and plan for goal tracking and growth accordingly.
Thanks in advance!
Hi,
This information can be viewed in the reports, feel free to create an issue to request having it added to the dashboard.
Hi Hillel, thanks for the response. Maybe you can provide a little more insight on how exactly I am supposed to extrapolate that information from the reports section, as I have tried to use reports extensively without much luck (they usually require quite a bit of manual excel work to get close to a basic report of total hours logged over X period of time).
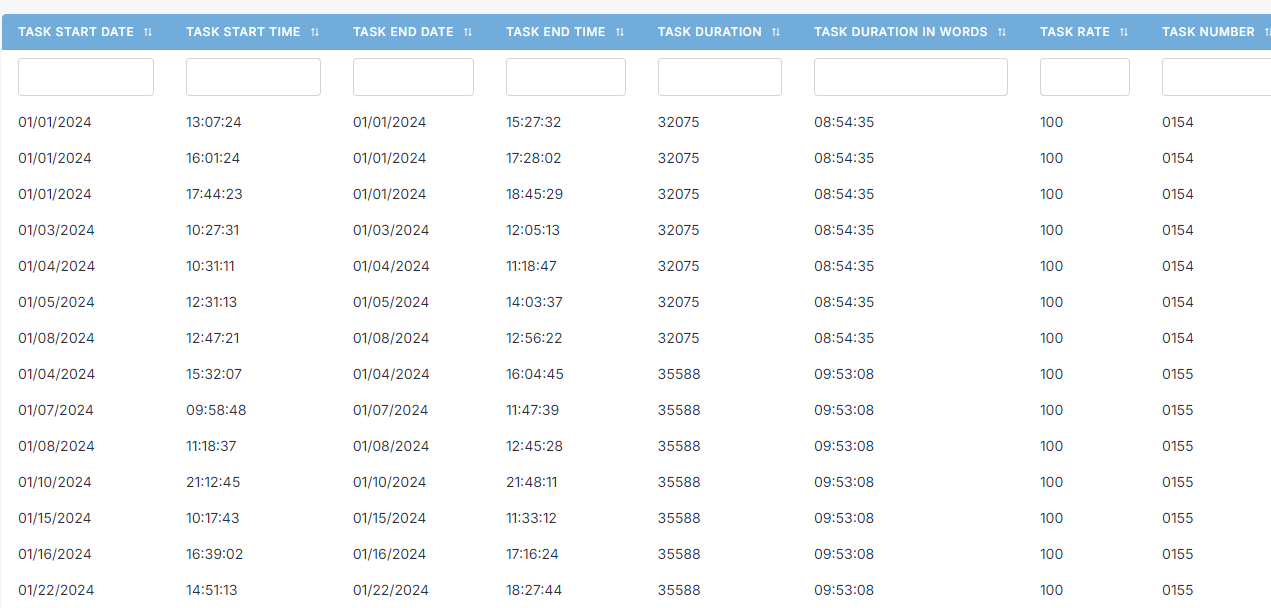
For example, if I run a report for “Task”, and set the status of tasks to “All” for the range of “This Year” I get a dump of every time I logged to a task, meaning multiple entries per task. Each entry has a field for “Duration”, which is the total duration of that task, as opposed to the duration of that entry. So it is sort of broken in that way. You can see an example below. I would expect to instead see the Task Duration for each entry be the duration from the task start time to the task end time. This would match up with what is shown under the actual task under the Tasks menu, but it doesn’t, perhaps this is a bug? If it reported the duration of each “chunk” correctly, I could then easily do a quick sum of that entire row and get the total time logged to tasks for that exported time range.
Nonetheless, it seem cumbersome to have to do anything in excel for such a basic data point, does it not? Maybe I am an outlier here and most folks aren’t using the time tracking feature, but to me it is the most valuable part of this software.
Using the reports section of the older windows app gets me a little bit closer, but not by much. I receive a total duration but it just doesn’t seem to be right based on my total payments for the selected period. I can’t quite tell how it’s working there. For example doing a Report for Task > Duration for This Year gives me 1054613 seconds, so 292.95 hours. All of these hours were billed at roughly $100/hour (a few $87.50 and $75 per hour sprinkled in) and thus total payments for this year (including accounts payable/unsent or unpaid invoices) should be roughly ~$29,295. However, per the dashboard I have $24,433 in completed payments, $8,409 in outstanding invoices, and $4,487 in logged tasks, which is totaled is ~$8,000 over the ~$29,295 indicated by the tasks report. Note that I do not invoice anything besides actual logged hours in my system.
Am I missing something here?
Thanks for the detailed info!
For the React web app please create an issue here if you’d like to see any improvements or if you think there’s a bug which needs to be resolved.
Issues for the Windows app are tracked here. FYI… I’m the main developer of the desktop/mobile app. It would be helpful if you can provide steps to reproduce the issue, you may want to create a blank new company to test in.
Great, I actually pretty much strictly use the Windows app and the iOS app, as opposed to the web app, so I will create an issue there.
Sounds good, happy to help you with these changes.
I’ve been thinking recently about tasks/dashboard. A common request is being able to see how much work has been done today easily but making it customizable is useful.
Well since we are talking about the windows app, just simply adding hours as a metric to the customizable fields on the dashboard would give me everything that I need, honestly, as long as it doesn’t exhibit the same (buggy?) behavior as the dollar reporting of tasks described below.
I don’t mind doing a little math on the dollar amount when looking at “Logged Tasks” (which shows the dollar amount equivalent of my logged tasks for the period), but the big issue with that is what I mentioned earlier:
Let’s say that I have been working on a task over the past 7 days including today, at $100/hour. Each day I log 10 hours to that task, so today the total amount logged to that task is 70 hours. If I do a custom view of Logged Tasks over the last 2 days including today, it will show me $7000, instead of $2000. To me, this is definitely a bug. I realize the task has that many hours logged to it, but I want to view the work done/income generated over that specifically defined period.
This makes granular tracking of time worked very challenging, which is why I made this post to see if there was a way to look at hours logged to all tasks over specific days as opposed to looking at tasks as a whole. If this weird “chunking” were fixed, then I would have everything I need to really quickly get the stats I want.
I just submitted an issue for this bug: Reporting of tasks is over time periods is incorrect. · Issue #651 · invoiceninja/admin-portal · GitHub
If this is fixed then I will have everything I need.
Also a (potentially stupid) question: does the Windows app keep itself updated or do I need to download and install updated versions?
Thanks for creating the issue! I think if you use the task item report you should be able to calculate the correct amounts.
I believe the Windows app can update itself from the store but it depends on which version of Windows you’re using.